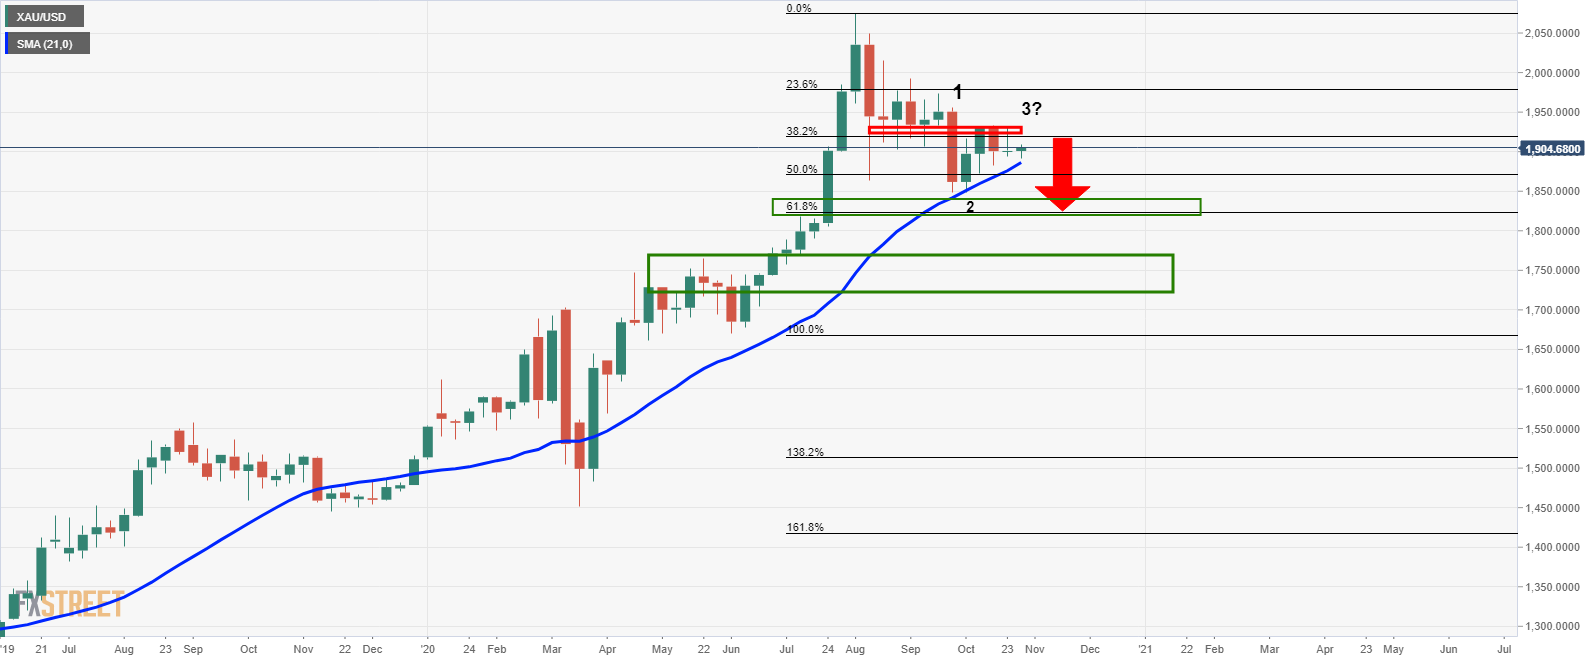
Gold is not going down without a fight on the short-term time frames.
The broader bias remains in the hands of the bears.
Gold is under pressure on the weekly and daily chart , but the 4-hour time frame is proving problematic to the bearish case.
The following illustrates the bearish bias in a top-down analysis: Weekly chart There is an opportunity on the weekly chart to trade the next downside extension following the latest correction. Daily chart The daily chart shows that the price has already broken trendline support which is now expected to act as a counter trend line resistance.A break below the 21-day moving average would add more conviction to the bearish case. 4-hour chart However, the bearish outlook has not been an easy ride so far on the 4-hour time frame.The yellow metal remains coiled in a tight range.The price action has been unfavourable […]
Click here to view original web page at www.fxstreet.com
Posting Guidelines
- Do contribute something to the discussion
- Do post factual information, analysis and your view on company valuations
- Do disclose if you have an interest in a security
- Do take our Terms of Use seriously
- Do not make low-content posts, unsubstantiated ramps or untruthful/misleading statements
- Do not complain about a post unless you have reported it first, and not on the forum.
- Do not post financial advice
- Do not advertise or post sponsored content

Get involved!
Get Connected!
Come and join our community. Expand your network and get to know new people!
Comments