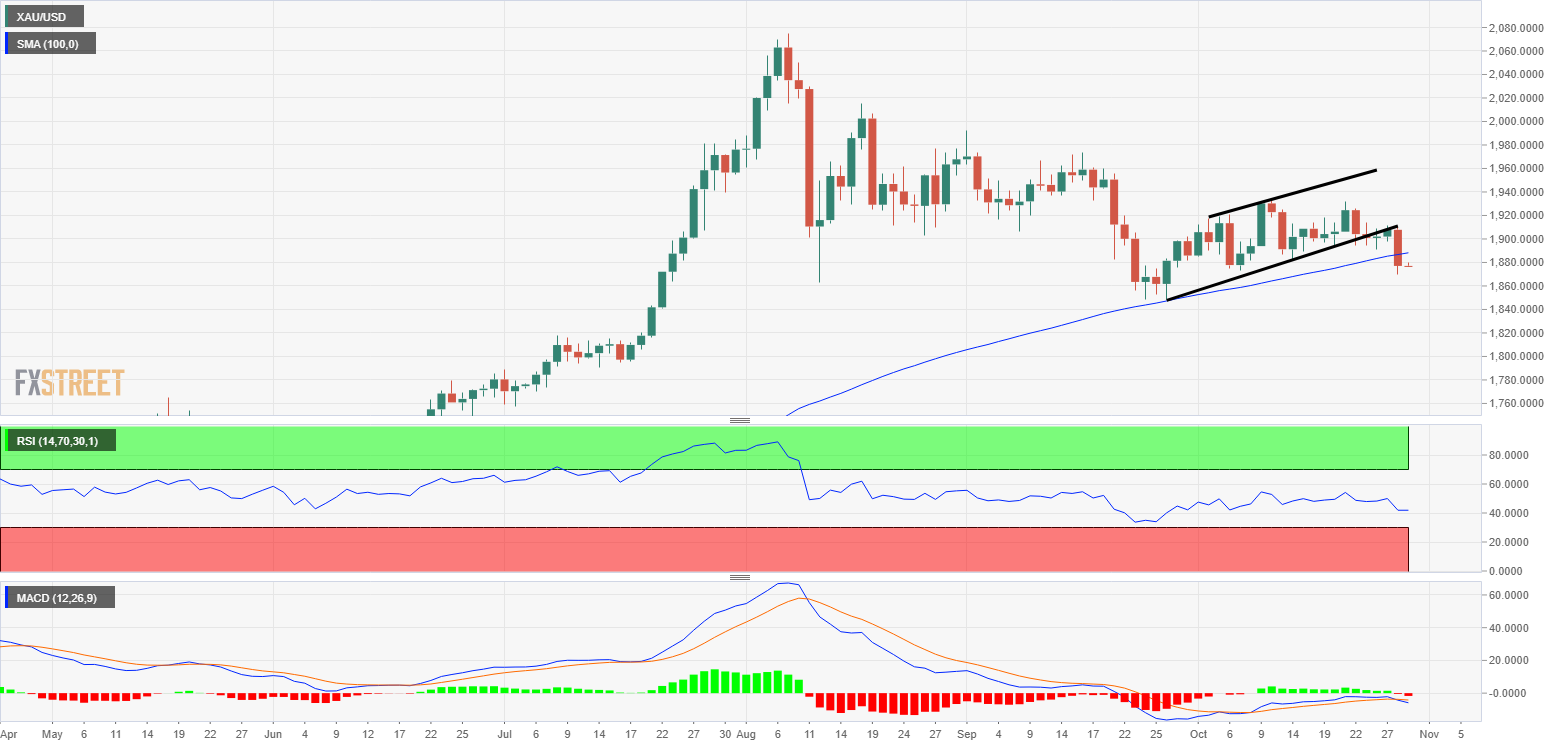
Gold has found acceptance below the 100-day SMA support.
The breakdown is backed by bearish readings on key indicators.
A bigger decline may be in the offing.
Gold looks south, having breached the widely-tracked 100-day simple moving average (SMA) support for the first time since March 23.The yellow metal fell by 1.67% on Wednesday and closed below the 100-day SMA, flipping the long-term technical support into resistance. The SMA is currently located at $1,887, and the metal is trading at $1,878 per ounce.Wednesday’s drop also marked a downside break of the ascending channel represented by trendlines connecting Sept. 28 and Oct. 14 lows and Oct. 2 and Oct. 12 highs.The rising channel breakdown and the 100-day SMA violation are backed by a below-50 or bearish reading on the 14-day relative strength index. Further, the MACD histogram has crossed below zero, indicating a bearish reversal.As such, gold […]
Click here to view original web page at www.fxstreet.com
Posting Guidelines
- Do contribute something to the discussion
- Do post factual information, analysis and your view on company valuations
- Do disclose if you have an interest in a security
- Do take our Terms of Use seriously
- Do not make low-content posts, unsubstantiated ramps or untruthful/misleading statements
- Do not complain about a post unless you have reported it first, and not on the forum.
- Do not post financial advice
- Do not advertise or post sponsored content

Get involved!
Get Connected!
Come and join our community. Expand your network and get to know new people!
Comments