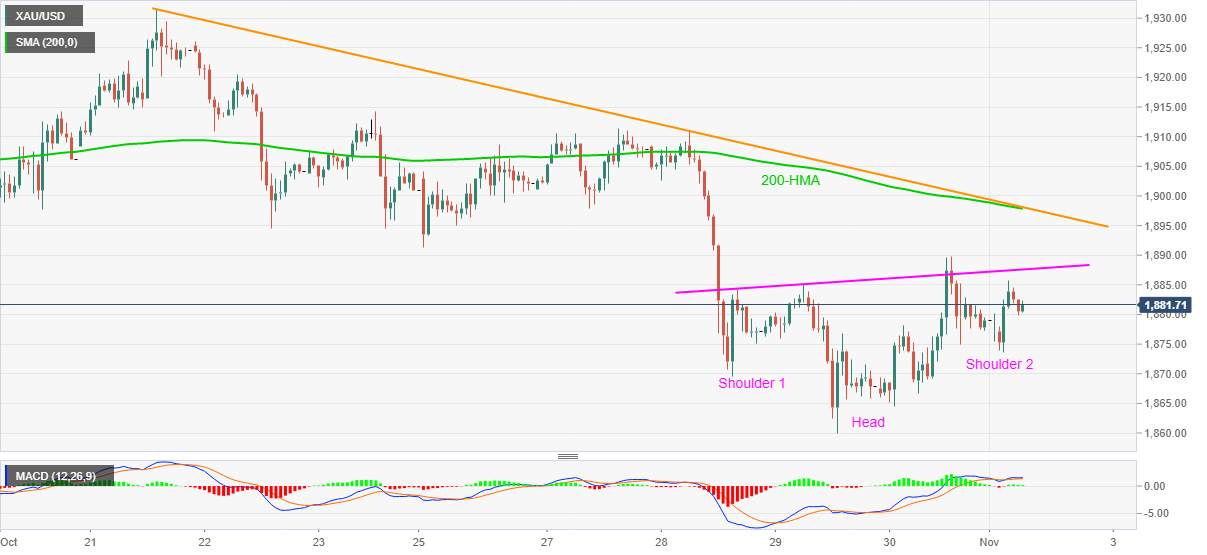
Gold picks up the bids, keeps Friday’s recovery moves.
200-HMA, eight-day-old resistance line offers tough resistance following the confirmation of a bullish chart pattern.
September lows can entertain short-term bears before highlighting early-July top.
Gold prices print mild gains of 0.16% on a day while taking rounds to $1,882 during the pre-European session trading. In doing so, the yellow metal portrays an inverse head and shoulders bullish chart pattern on the hourly (1H) formation.With the MACD flashing bullish signals, even if milder, odds of the quote’s upside break to the pattern’s neckline, at $1,887.60 now, become brighter.However, a confluence of 200-HMA and a falling trend line from October 21 can challenge gold buyers around $1,892 afterward. During the metal’s sustained run-up past-$1,892, the $1,900 threshold holds the key to further upside.Alternatively, $1,873 and the previous month’s low near $1,860 can act as immediate supports ahead of […]
Click here to view original web page at www.fxstreet.com
Posting Guidelines
- Do contribute something to the discussion
- Do post factual information, analysis and your view on company valuations
- Do disclose if you have an interest in a security
- Do take our Terms of Use seriously
- Do not make low-content posts, unsubstantiated ramps or untruthful/misleading statements
- Do not complain about a post unless you have reported it first, and not on the forum.
- Do not post financial advice
- Do not advertise or post sponsored content

Get involved!
Get Connected!
Come and join our community. Expand your network and get to know new people!
Comments