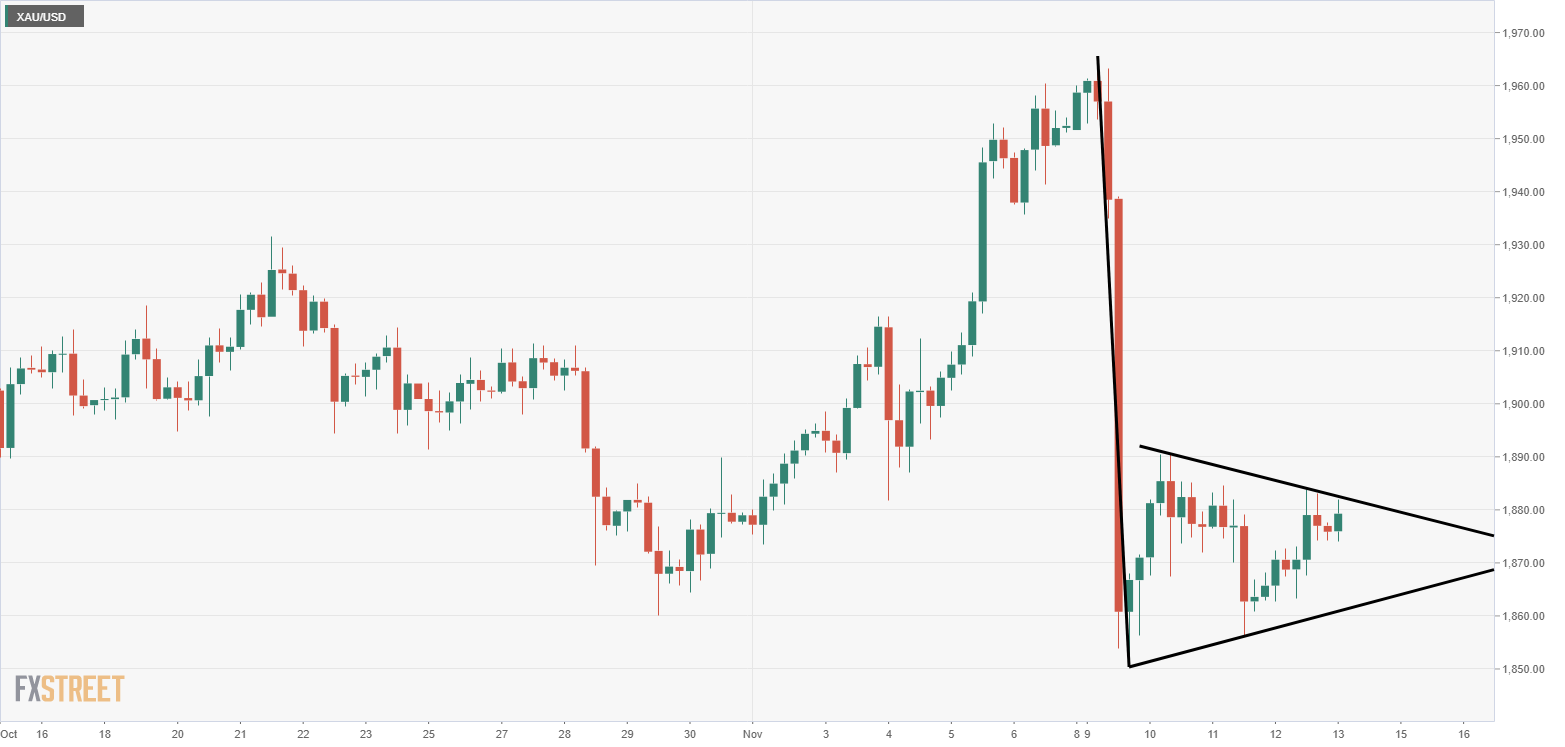
Gold’s 4-hour chart shows a bearish pennant pattern.
A breakdown would shift the focus to support at $1,800.
Gold fell by over 4% on Monday and has been trading back and forth in a narrowing price ever since.
The price action has taken the shape of a bearish pennant pattern on the 4-hour chart .A break below the pennant support, currently at $1,859, would imply a resumption of the sell-off from Monday’s high of $1,965 and shift risk in favor of a drop to the psychological support of $1,800 (target as per the measured move method).Alternatively, a breakout above the upper end would expose the 10-day simple moving average (SMA) at $1,896. At press time, gold is trading at $1,880 per ounce, representing a 0.17% gain on the day. 4-hour chart Trend: Neutral Technical levels Information on these pages contains forward-looking statements that involve risks and uncertainties. Markets […]
Click here to view original web page at www.fxstreet.com

Posting Guidelines
- Do contribute something to the discussion
- Do post factual information, analysis and your view on company valuations
- Do disclose if you have an interest in a security
- Do take our Terms of Use seriously
- Do not make low-content posts, unsubstantiated ramps or untruthful/misleading statements
- Do not complain about a post unless you have reported it first, and not on the forum.
- Do not post financial advice
- Do not advertise or post sponsored content
Get involved!
Get Connected!
Come and join our community. Expand your network and get to know new people!
Comments