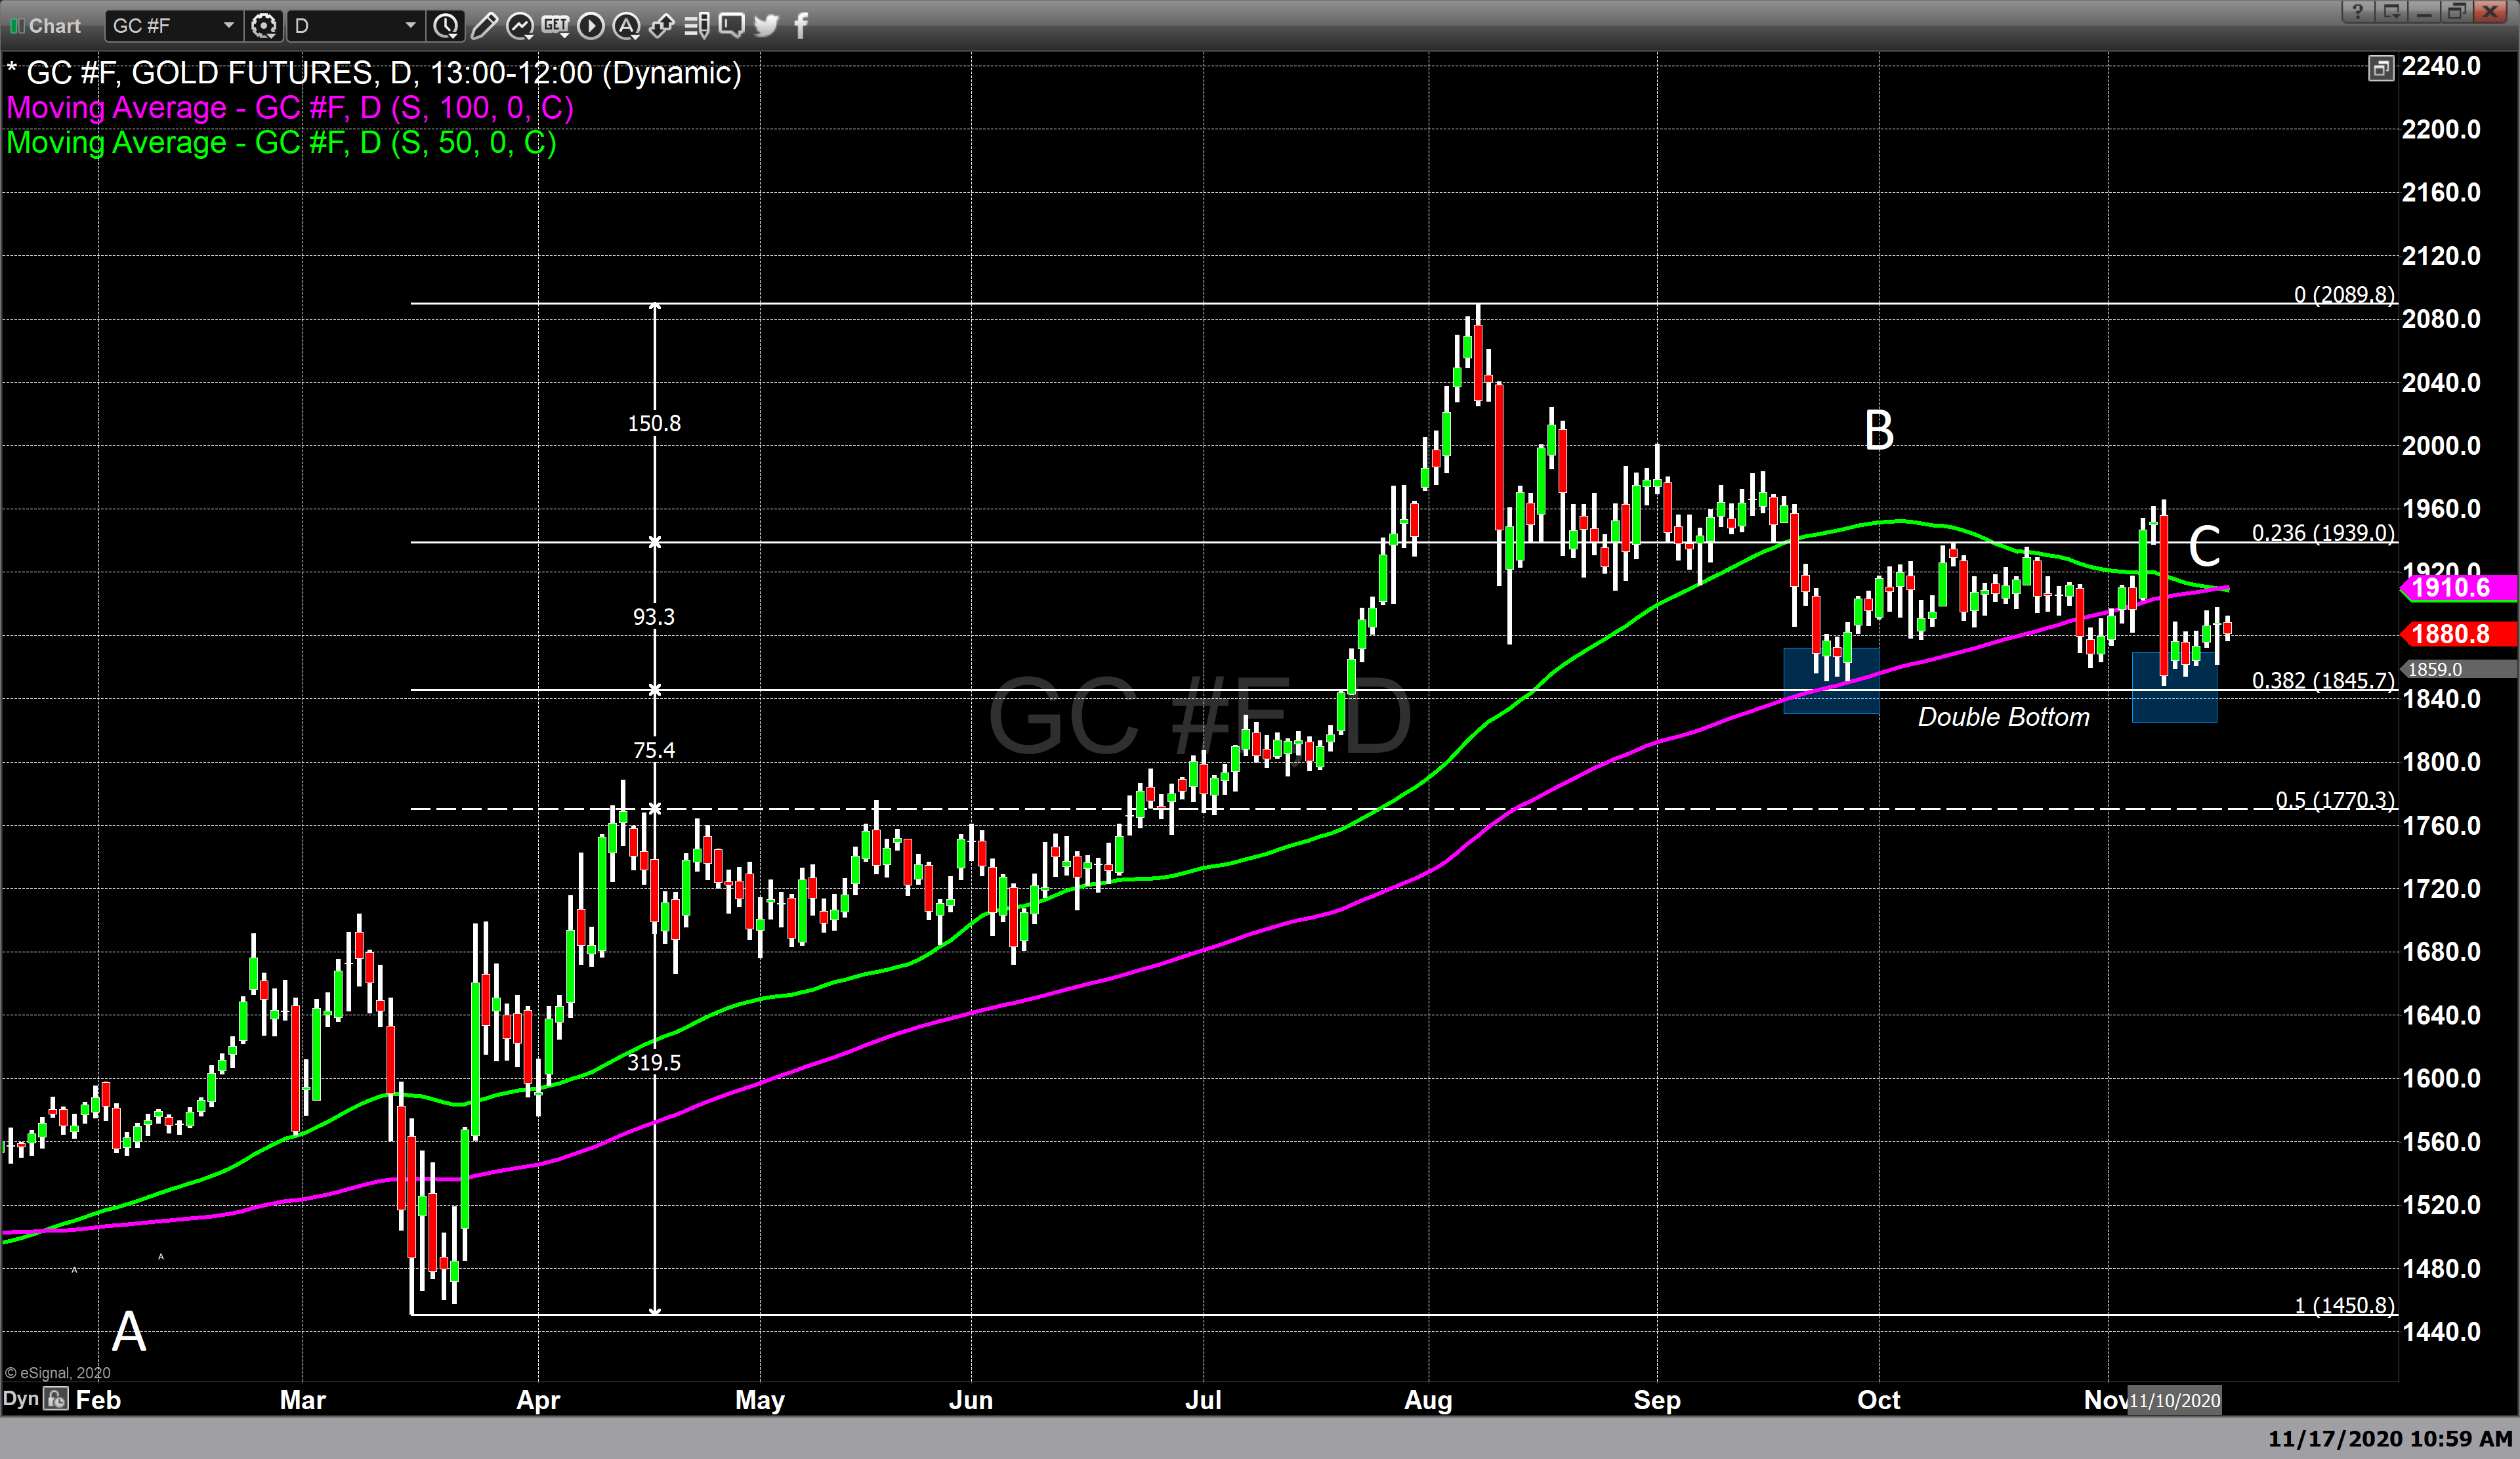
For the first time since January 2020, the 50-day moving average (green line) crossed below the 100-day moving average (magenta line), illustrated on today’s chart labelled as “C”. This is commonly referred to as a death cross. Most frequently the term is about when the 50dma crosses below the 200dma. However, it can be used as a term to describe whenever a shorter-term moving average moves below a longer-term one. In the middle of January at the start of 2020 is the last time we had these averages cross back (item “A” on the chart) into a bullish alignment, (shorter above longer) when the 50dma moved above the 100dma. This correlation remained for the monumental rally lasting eight months that eventually brought gold to its all-time high. the differential between the two averages remained approximately $60 as they rose in unison for nine straight months. In the last week […]
Click here to view original web page at www.kitco.com

Posting Guidelines
- Do contribute something to the discussion
- Do post factual information, analysis and your view on company valuations
- Do disclose if you have an interest in a security
- Do take our Terms of Use seriously
- Do not make low-content posts, unsubstantiated ramps or untruthful/misleading statements
- Do not complain about a post unless you have reported it first, and not on the forum.
- Do not post financial advice
- Do not advertise or post sponsored content
Get involved!
Get Connected!
Come and join our community. Expand your network and get to know new people!
Comments